
Certificate in Data Visualization and Mathematical Storytelling
Master data visualization and mathematical storytelling to transform complex data into compelling, actionable insights for strategic decision-making.
Certificate in Data Visualization and Mathematical Storytelling
About This Course
The Certificate in Data Visualization and Mathematical Storytelling and Mathematical Storytelling equips professionals with the technical expertise to transform complex datasets into compelling visual narratives. This programme targets analysts, marketers, and business leaders who seek to bridge the gap between raw statistics and strategic decision-making. Participants engage with industry-standard tools like Tableau and Python libraries to master the art of data interpretation. You will learn to identify key patterns within large datasets and present them with clarity and precision. The curriculum emphasizes ethical data representation and audience-centric design principles to ensure your insights resonate with stakeholders.
Learners develop advanced proficiency in statistical modeling, color theory, and interactive dashboard creation throughout this intensive course. You will acquire the ability to select appropriate chart types that accurately reflect underlying mathematical relationships without misleading viewers. The programme teaches you to craft data-driven stories that guide audiences from problem identification to solution implementation. Students practice simplifying intricate algorithms into accessible visual formats that enhance comprehension for non-technical teams. You will also gain experience in A/B testing visual designs to optimize engagement and information retention rates.
Completing this certificate significantly boosts your employability in data-centric roles across finance, healthcare, and technology sectors. Employers value candidates who can translate analytical findings into actionable business strategies effectively. You will position yourself as a strategic communicator who drives organizational growth through clear insight delivery. Graduates often secure promotions or transition into senior roles such as Data Storyteller or Visualization Specialist. This credential validates your ability to lead data initiatives and influence high-level corporate
What You Will Learn
Transform complex datasets into compelling narratives that drive decision-making with our Certificate in Data Visualization and Mathematical Storytelling. In today’s information-saturated world, the ability to translate raw numbers into clear, actionable insights is a superpower. This programme bridges the gap between technical analysis and effective communication, empowering you to become a trusted advisor in any organization. You will move beyond simple chart creation to master the art of visual rhetoric, ensuring your audience understands not just the what, but the why behind the data.
The curriculum covers essential topics including statistical foundations, color theory, and layout design principles. You will gain hands-on experience with industry-standard tools like Tableau, Power BI, and Python libraries such as Matplotlib and Seaborn. We emphasize ethical storytelling, teaching you how to present data honestly while highlighting key trends and anomalies. Through rigorous case studies, you will learn to identify the right visual format for different audiences, from executive dashboards to public-facing reports.
Graduates apply these skills immediately in roles requiring clarity and precision. You will craft interactive dashboards for marketing teams, visualize financial trends for stakeholders, or create educational materials for non-profit organizations. Employers value candidates who can simplify complexity without losing nuance. This certificate holders often find success as Data Visualization Specialists, Business Intelligence Analysts, or Insights Managers. Whether you are looking to pivot into a data-centric role or enhance your current position, this certificate provides the practical toolkit you need. Join a community of learners dedicated to making data accessible
Course Benefits
Industry-Aligned Curriculum
Developed with industry leaders for job-ready skills
Globally Recognised Certificate
Recognised by employers across 180+ countries
Flexible Online Learning
Study at your own pace with lifetime access
Instant Access
Start learning immediately, no application process
Constantly Updated Content
Latest industry trends and best practices
Career Advancement
87% report measurable career progression within 6 months
What This Course Covers
- Data Foundations: Introduces essential data types, cleaning techniques, and ethical considerations for visualization.: Visual Perception: Explores how humans process visual information and the cognitive principles behind effective chart design.
- Statistical Storytelling: Teaches how to use statistical concepts like distributions and correlations to build narratives.: Tool Proficiency: Provides hands-on training with industry-standard software such as Tableau, Power BI, or Python libraries.
- Narrative Structure: Focuses on crafting compelling stories by sequencing data points and selecting appropriate visual metaphors.: Portfolio Project: Requires students to create a complete data visualization case study that demonstrates mastery of all course skills.
Everything You Get With This Course
Course Facts
Audience: Professionals seeking to master data storytelling skills.
Prerequisites: Basic familiarity with data analysis tools.
Outcomes: Create compelling visual narratives that drive decisions.
Unlock your potential to transform complex numbers into clear, impactful stories. This certificate empowers you to communicate insights effectively, boosting your career value. You will gain practical skills in designing charts that engage stakeholders and clarify trends. Start your journey toward becoming a confident data communicator today. Your ability to visualize data will set you apart in any competitive job market.
Ready to Advance Your Career?
Join thousands of professionals who have transformed their careers with LSBR UK
Why This Course Is Right for You
You stand at a pivotal moment in your career where data literacy is no longer optional but essential. The Certificate in Data Visualization and Mathematical Storytelling offers a transformative path to mastering this critical domain. Here is why this program deserves your attention.
You will bridge the gap between complex analytics and actionable insights. By learning to translate raw numbers into compelling visual narratives, you become the vital link between technical teams and decision-makers. This ability ensures your work drives strategic choices rather than gathering dust in reports.
You gain mastery over industry-standard tools and design principles. The curriculum emphasizes practical application, allowing you to build a robust portfolio of interactive dashboards and static visuals. Employers value candidates who can immediately contribute to their data infrastructure without extensive onboarding.
You develop the rare skill of mathematical storytelling. Data alone rarely persuades; context does. This certificate teaches you to craft narratives that engage stakeholders, making your presentations memorable and influential. You learn to highlight key trends while suppressing noise, ensuring your audience grasps the core message instantly.
You position yourself for higher earning potential and leadership roles. Professionals who can communicate data effectively are increasingly sought after in marketing, finance, and operations. This credential signals to recruiters that you possess both technical proficiency and the soft skills necessary for cross-functional collaboration.
Invest in your future by choosing a program that empowers you to speak the language of data with confidence and clarity. Your career growth depends on it.
3-4 Weeks
Study at your own pace
Course Brochure
Download our comprehensive course brochure with all details
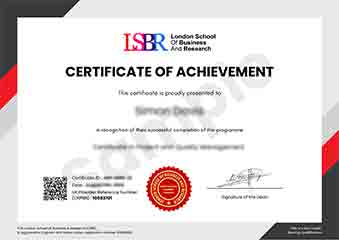
Sample Certificate
Preview the certificate you'll receive upon successful completion of this program.
Get Free Course Info
Receive detailed course information, curriculum breakdown, and career outcomes straight to your inbox.
Employer Sponsored?
Many employers cover professional development costs. Request a corporate invoice and we'll handle the rest. Bulk enrollment discounts available for teams of 3+.
How You Earn Your Certificate
Four simple steps to your professionally recognised qualification
Enroll & Get Instant Access
Complete your enrollment and access course materials immediately
Study at Your Own Pace
Work through the modules on your schedule, from anywhere in the world
Complete Assessments
Demonstrate your knowledge through practical, real-world assessments
Receive Your Certificate
Get your official LSBR UK certificate, recognised across 180+ countries
Real Results from Real Learners
Our graduates consistently report measurable career growth and professional advancement after completing their programmes.
Reviews from Our Learners
Hear from our students about their experience with the Certificate in Data Visualization and Mathematical Storytelling at LSBR UK - Executive Education.
Oliver Davies
United Kingdom"The course material effectively bridges the gap between complex statistical concepts and clear visual narratives, making dense data accessible and engaging. I gained practical skills in selecting the right chart types and designing intuitive dashboards that significantly enhance my ability to communicate insights in a professional setting."
Isabella Dubois
Canada"Mastering the art of translating complex datasets into compelling visual narratives has completely transformed how I communicate insights to stakeholders. This practical expertise allowed me to secure a senior analytics role where I now lead data-driven strategy initiatives."
Ruby McKenzie
Australia"The logical progression of modules made complex statistical concepts feel accessible and immediately applicable to my daily work. I now possess a robust framework for transforming raw data into compelling visual narratives that drive strategic decision-making."
Need more time to decide?
Join 23,000+ professionals who advanced their careers. Enroll today and start learning immediately.
Enroll NowSecure payment • Instant access • Certificate included