
Executive Development Programme in Research Data Analysis and Visualization
This programme equips executives with advanced skills in research data analysis and visualization, enhancing decision-making and strategic insights.
Executive Development Programme in Research Data Analysis and Visualization
About This Course
The Executive Development Programme in Research Data Analysis and Visualization is designed for senior executives and professionals aiming to enhance their analytical capabilities and strategic decision-making skills through data-driven insights. This program integrates advanced methodologies in data analysis and visualization, equipping participants with the tools and techniques to interpret complex datasets and transform raw data into actionable intelligence. Participants will learn to use cutting-edge software and tools, including R, Python, Tableau, and SQL, to conduct rigorous data analysis, perform predictive modeling, and create compelling visualizations that communicate data insights effectively.
Learners will develop key competencies in statistical analysis, machine learning, data visualization, and data storytelling. They will gain proficiency in handling large datasets, applying statistical tests, and building predictive models. Additionally, they will master the art of creating clear and engaging visual representations of data, which are essential for effective communication and stakeholder engagement. By the end of the program, participants will be adept at leveraging data analytics to drive business strategy, make informed decisions, and communicate insights that impact organizational performance.
The program has a significant impact on participants' careers, enabling them to lead data-driven initiatives and drive innovation within their organizations. Graduates will be better positioned to navigate complex data landscapes, identify strategic opportunities, and foster a data-informed culture. This program not only enhances individual capabilities but also contributes to organizational success by providing a cadre of leaders who can effectively leverage data to achieve strategic objectives.
What You Will Learn
The Executive Development Programme in Research Data Analysis and Visualization is an intensive, month course tailored for experienced professionals aiming to enhance their analytical and visualization skills. This program equips participants with the latest techniques in data-driven decision making, offering a comprehensive curriculum that includes statistical analysis, machine learning, data visualization, and predictive modeling. By the end of the program, graduates are adept at transforming raw data into actionable insights that drive business strategy and innovation.
Participants will learn to use advanced tools such as Python and R for data manipulation, and specialized software for data visualization, enabling them to create compelling visual representations of complex data. The program also emphasizes real-world application, with case studies and projects that mirror professional challenges, allowing participants to apply their skills in practical settings.
Upon completion, graduates are well-prepared for leadership roles in data science, research, and analytics. They can lead data-driven initiatives, optimize processes, and make informed decisions that align with organizational goals. Potential career paths include data scientist, research analyst, analytics manager, and business intelligence specialist. Graduates emerge as strategic thinkers who can leverage data to enhance decision-making and drive organizational success.
Course Benefits
Industry-Aligned Curriculum
Developed with industry leaders for job-ready skills
Globally Recognised Certificate
Recognised by employers across 180+ countries
Flexible Online Learning
Study at your own pace with lifetime access
Instant Access
Start learning immediately, no application process
Constantly Updated Content
Latest industry trends and best practices
Career Advancement
87% report measurable career progression within 6 months
What This Course Covers
- Foundational Concepts: Covers the core principles and key terminology.: Data Collection Techniques: Discusses various methods for gathering and managing data.
- Statistical Analysis: Introduces statistical methods and tools for data analysis.: Data Visualization Basics: Teaches the fundamentals of creating effective visual representations.
- Advanced Visualization Techniques: Explores complex visualization methods and tools.: Project Management: Focuses on strategies for managing research projects effectively.
Everything You Get With This Course
Course Facts
For professionals in research and data science
No prior experience required
Enhanced skills in data analysis
Developed proficiency in data visualization
Improved ability to interpret complex data
Increased confidence in data-driven decision-making
Ready to Advance Your Career?
Join thousands of professionals who have transformed their careers with LSBR UK
Why This Course Is Right for You
Enhanced Data Literacy: Professionals who undertake the Executive Development Programme in Research Data Analysis and Visualization gain a deep understanding of data manipulation, statistical analysis, and data visualization techniques. This not only enhances their ability to interpret complex data but also equips them to communicate insights effectively to stakeholders, a critical skill in today's data-driven landscape.
Competitive Advantage: The programme introduces advanced tools and software like R, Python, and Tableau, which are highly sought after in the job market. By mastering these tools, professionals can develop sophisticated data analysis solutions, making them stand out in competitive job markets and potentially leading to higher job security and better career opportunities.
Strategic Insights: The programme focuses on translating data insights into actionable strategies. This skill is invaluable for executives who need to make informed decisions based on data. By learning how to derive strategic insights from data, professionals can contribute more effectively to organizational goals, driving business growth and innovation.
Interdisciplinary Knowledge: The programme integrates knowledge from various disciplines, including statistics, computer science, and business analytics. This interdisciplinary approach enables professionals to apply data analysis in diverse contexts, such as finance, healthcare, and marketing, broadening their career prospects and making them versatile assets in any organization.
3-4 Weeks
Study at your own pace
Course Brochure
Download our comprehensive course brochure with all details
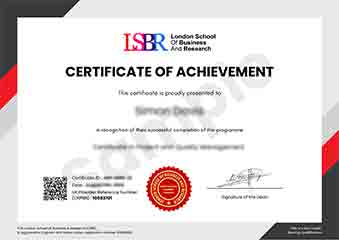
Sample Certificate
Preview the certificate you'll receive upon successful completion of this program.
Get Free Course Info
Receive detailed course information, curriculum breakdown, and career outcomes straight to your inbox.
Employer Sponsored?
Many employers cover professional development costs. Request a corporate invoice and we'll handle the rest. Bulk enrollment discounts available for teams of 3+.
How You Earn Your Certificate
Four simple steps to your professionally recognised qualification
Enroll & Get Instant Access
Complete your enrollment and access course materials immediately
Study at Your Own Pace
Work through the modules on your schedule, from anywhere in the world
Complete Assessments
Demonstrate your knowledge through practical, real-world assessments
Receive Your Certificate
Get your official LSBR UK certificate, recognised across 180+ countries
Real Results from Real Learners
Our graduates consistently report measurable career growth and professional advancement after completing their programmes.
Reviews from Our Learners
Hear from our students about their experience with the Executive Development Programme in Research Data Analysis and Visualization at LSBR UK - Executive Education.
Oliver Davies
United Kingdom"The course provided high-quality, practical content that significantly enhanced my skills in data analysis and visualization, equipping me with tools and techniques that are directly applicable in my research work and career."
Kai Wen Ng
Singapore"The Executive Development Programme in Research Data Analysis and Visualization has been instrumental in enhancing my analytical skills and providing me with practical tools to visualize complex data sets. This course has not only made my work more impactful but has also opened up new career opportunities in data-driven roles within my industry."
Ryan MacLeod
Canada"The course structure is well-organized, providing a comprehensive overview of research data analysis and visualization that seamlessly bridges theoretical knowledge with practical applications, significantly enhancing my ability to tackle real-world data challenges."
Need more time to decide?
Join 23,000+ professionals who advanced their careers. Enroll today and start learning immediately.
Enroll NowSecure payment • Instant access • Certificate included