
Executive Development Programme in Weather Data Visualization and Reporting
Embrace digital transformation with advanced weather data visualization and reporting capabilities. Stay ahead in the evolving technological landscape.
Executive Development Programme in Weather Data Visualization and Reporting
About This Course
The Executive Development Programme in Weather Data Visualization and Reporting is designed for professionals in meteorology, data science, and related fields who seek to enhance their expertise in visualizing and reporting weather data. This program is tailored for those who wish to leverage advanced visualization techniques to communicate complex weather data effectively, ensuring insights are accessible and actionable for stakeholders.
Key skills and knowledge learners will develop include proficiency in using cutting-edge data visualization tools, such as Tableau and Python, to create dynamic and interactive weather visualizations. They will also gain a deep understanding of data analytics, allowing them to derive meaningful insights from large datasets. Additionally, participants will learn best practices in data storytelling, enabling them to craft compelling narratives that enhance data comprehension and drive informed decision-making.
This program significantly impacts career growth by equipping participants with the skills necessary to excel in roles that require advanced data analysis and visualization. Graduates will be well-prepared to lead projects that integrate data-driven approaches in weather forecasting, climate analysis, and environmental monitoring. The program also facilitates networking opportunities with industry leaders, opening doors to advanced positions and collaborative opportunities in the field.
What You Will Learn
The Executive Development Programme in Weather Data Visualization and Reporting is a cutting-edge initiative designed to equip professionals with the skills to harness the power of weather data for strategic decision-making. This program blends theoretical knowledge with hands-on training, offering a unique blend of data science, meteorology, and visualization techniques. Participants will learn to analyze, interpret, and present complex weather data using advanced tools and software, including Python and Tableau. The curriculum covers essential topics such as climate change impacts, predictive modeling, and effective data storytelling.
Upon completion, graduates will be well-prepared to apply these skills in various sectors, including environmental consulting, renewable energy, insurance, and agriculture. They will be able to develop customized weather reports, create interactive visualizations for public dissemination, and contribute to the development of more resilient communities and industries. The program not only enhances technical proficiency but also fosters leadership qualities, essential for navigating the evolving landscape of weather data management.
Career opportunities abound for graduates, ranging from data analysts to weather data managers, specializing in areas such as disaster preparedness, risk assessment, and sustainable development. By mastering the art and science of weather data visualization and reporting, participants will be at the forefront of innovation, driving informed decisions that can positively impact society and the environment.
Course Benefits
Industry-Aligned Curriculum
Developed with industry leaders for job-ready skills
Globally Recognised Certificate
Recognised by employers across 180+ countries
Flexible Online Learning
Study at your own pace with lifetime access
Instant Access
Start learning immediately, no application process
Constantly Updated Content
Latest industry trends and best practices
Career Advancement
87% report measurable career progression within 6 months
What This Course Covers
- Data Sources and Collection: Discusses various sources and methods for collecting weather data.: Data Cleaning and Preprocessing: Focuses on techniques for cleaning and preparing data for analysis.
- Visualization Tools and Libraries: Introduces tools and libraries used for creating weather visualizations.: Interactive Dashboards: Teaches how to create and design interactive weather dashboards.
- Report Writing and Presentation: Covers best practices for writing and presenting weather reports.: Case Studies and Industry Applications: Analyzes real-world case studies and applications in weather data visualization and reporting.
Everything You Get With This Course
Course Facts
Audience: Data scientists, analysts, meteorologists
Prerequisites: Basic data analysis skills, weather knowledge
Outcomes: Advanced visualization techniques, enhanced reporting skills
Ready to Advance Your Career?
Join thousands of professionals who have transformed their careers with LSBR UK
Why This Course Is Right for You
Enhanced Data Interpretation Skills: An Executive Development Programme in Weather Data Visualization and Reporting equips professionals with advanced tools and techniques for interpreting complex weather data. This skill is crucial for making informed decisions, whether in meteorology, environmental science, or related fields. For example, understanding how to visualize patterns and trends in temperature or precipitation can significantly improve predictive models and disaster preparedness strategies.
Improved Reporting Capabilities: The programme focuses on developing clear and effective reporting skills, enabling professionals to communicate weather data and its impacts to stakeholders, including the public and policy-makers. This proficiency is vital for roles requiring public engagement, such as in the media, government agencies, or non-profit organizations. For instance, being able to explain severe weather conditions in easily understandable terms can enhance public safety awareness.
Adaptation to Technological Changes: Weather data visualization and reporting are increasingly reliant on advanced technologies like AI and machine learning. The programme ensures professionals stay updated with these technological advancements, allowing them to integrate new tools into their work. This adaptability can open up new career opportunities in tech-driven sectors or enable them to lead innovation in their current roles.
3-4 Weeks
Study at your own pace
Course Brochure
Download our comprehensive course brochure with all details
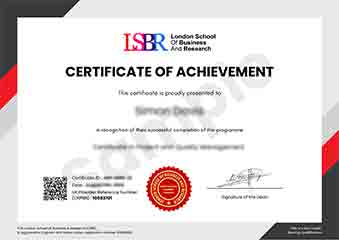
Sample Certificate
Preview the certificate you'll receive upon successful completion of this program.
Get Free Course Info
Receive detailed course information, curriculum breakdown, and career outcomes straight to your inbox.
Employer Sponsored?
Many employers cover professional development costs. Request a corporate invoice and we'll handle the rest. Bulk enrollment discounts available for teams of 3+.
How You Earn Your Certificate
Four simple steps to your professionally recognised qualification
Enroll & Get Instant Access
Complete your enrollment and access course materials immediately
Study at Your Own Pace
Work through the modules on your schedule, from anywhere in the world
Complete Assessments
Demonstrate your knowledge through practical, real-world assessments
Receive Your Certificate
Get your official LSBR UK certificate, recognised across 180+ countries
Real Results from Real Learners
Our graduates consistently report measurable career growth and professional advancement after completing their programmes.
Reviews from Our Learners
Hear from our students about their experience with the Executive Development Programme in Weather Data Visualization and Reporting at LSBR UK - Executive Education.
Sophie Brown
United Kingdom"The course content was incredibly detailed and up-to-date, providing a solid foundation in weather data visualization and reporting that has directly enhanced my analytical skills and ability to interpret complex data sets. It has been invaluable in preparing me for more advanced roles in meteorology and data science."
Tyler Johnson
United States"The Executive Development Programme in Weather Data Visualization and Reporting has significantly enhanced my ability to interpret complex weather data, making my reports more insightful and actionable for stakeholders. This skill set has been incredibly valuable in my current role, leading to more effective communication and better decision-making processes in my organization."
Ruby McKenzie
Australia"The course structure is well-organized, providing a comprehensive overview of weather data visualization and reporting that seamlessly bridges theoretical knowledge with practical applications, enhancing my ability to analyze and present weather data effectively in a professional setting."
Need more time to decide?
Join 23,000+ professionals who advanced their careers. Enroll today and start learning immediately.
Enroll NowSecure payment • Instant access • Certificate included