
Postgraduate Certificate in Data Visualization Techniques for Statisticians
Master advanced visualization techniques to transform complex statistical data into clear, impactful insights for effective decision-making.
Postgraduate Certificate in Data Visualization Techniques for Statisticians
About This Course
This programme equips experienced statisticians with the essential visual communication tools needed to transform complex datasets into compelling narratives. You will master industry-standard software like Tableau and Python libraries such as Matplotlib and Seaborn to create precise, interactive dashboards. The curriculum addresses the critical gap between statistical rigor and audience engagement, ensuring your insights resonate with non-technical stakeholders. We designed this certificate for data professionals who already possess strong analytical foundations but seek to elevate their presentation capabilities.
You will develop a sophisticated understanding of visual perception principles, enabling you to choose the most effective chart types for various data structures. The coursework covers advanced techniques in geospatial mapping, time-series analysis, and multivariate data representation to minimize cognitive load for viewers. You will learn to apply color theory and layout design strategically, ensuring accessibility and clarity across diverse digital platforms. Our expert instructors guide you through real-world case studies, helping you refine your ability to highlight key trends and outliers without distorting the underlying statistical truth.
Graduates emerge with the confidence to lead data storytelling initiatives within their organizations. You will position yourself as a bridge between technical data teams and executive decision-makers, significantly enhancing your professional value. Employers increasingly seek statisticians who can translate numbers into actionable business strategies, making this skill set highly marketable. This certificate serves as a powerful differentiator in your career trajectory, opening doors to senior roles in data science, business intelligence, and strategic consulting.
What You Will Learn
Transform complex statistical models into compelling visual narratives with our Postgraduate Certificate in Data Visualization Techniques for Statisticians. In an era where data drives every major decision, the ability to communicate insights clearly is just as critical as the analysis itself. This programme bridges the gap between rigorous statistical computation and effective visual storytelling, empowering you to make your work accessible to stakeholders, executives, and the general public.
You will master industry-standard tools like Tableau, Power BI, and advanced R libraries such as ggplot2 and Shiny. The curriculum moves beyond basic charting to explore interactive dashboards, geospatial mapping, and ethical design principles that prevent misinterpretation. You will learn to select the right visual encoding for different data types, ensuring accuracy while maximizing impact. Through hands-on projects, you will refine your ability to distill multidimensional datasets into intuitive graphics that reveal hidden patterns and trends.
Graduates emerge with a versatile skill set that enhances their value in any data-driven organization. You will apply these techniques to create real-time monitoring systems for healthcare metrics, financial risk assessments, or marketing performance reports. Employers actively seek professionals who can translate raw numbers into strategic advantages. This certificate opens doors to roles such as Data Visualization Specialist, Statistical Consultant, or Business Intelligence Analyst. Whether you aim to lead a data team or influence policy through clear communication, this programme provides the technical proficiency and creative confidence you need. Join a community of forward-thinking statisticians ready to shape the future of data communication. Elev
Course Benefits
Industry-Aligned Curriculum
Developed with industry leaders for job-ready skills
Globally Recognised Certificate
Recognised by employers across 180+ countries
Flexible Online Learning
Study at your own pace with lifetime access
Instant Access
Start learning immediately, no application process
Constantly Updated Content
Latest industry trends and best practices
Career Advancement
87% report measurable career progression within 6 months
What This Course Covers
- Visual Perception and Cognitive Principles: Examines how humans process visual information and the psychological foundations of effective data representation.: Statistical Graphics Theory: Analyzes the mathematical and statistical underpinnings of charts, plots, and graphical models.
- Interactive Visualization Programming: Teaches coding skills using libraries like D3.js or Plotly to create dynamic and exploratory visual interfaces.: Color Theory and Typography: Focuses on the aesthetic and functional use of color palettes and text hierarchy to enhance clarity and accessibility.
- Geospatial and Network Data Visualization: Covers specialized techniques for mapping spatial relationships and complex network structures.: Ethical Communication and Storytelling: Addresses bias, misrepresentation, and the art of crafting compelling narratives from statistical evidence.
Everything You Get With This Course
Course Facts
Audience: Statisticians seeking to enhance their visual storytelling skills.
Prerequisites: Basic statistical knowledge and proficiency in R or Python.
Outcomes: Master compelling data narratives using modern visualization tools.
Unlock your potential to transform complex datasets into clear, impactful insights. This certificate empowers you to communicate findings effectively, bridging the gap between analysis and decision-making. Join us to refine your technical expertise and stand out in the competitive data landscape. Your career deserves this boost in clarity and influence.
Ready to Advance Your Career?
Join thousands of professionals who have transformed their careers with LSBR UK
Why This Course Is Right for You
Embarking on a Postgraduate Certificate in Data Visualization Techniques for Statisticians is a strategic move that bridges the gap between complex statistical analysis and compelling storytelling. This program empowers you to transform raw numbers into actionable insights, making your expertise indispensable in today’s data-driven landscape.
You will master advanced visualization tools like Tableau and Python libraries, enabling you to create interactive dashboards that stakeholders can explore independently. This technical proficiency significantly reduces the time spent on manual reporting, allowing you to focus on higher-level strategic analysis.
The curriculum emphasizes narrative design, teaching you how to structure visual presentations that guide decision-makers toward clear conclusions. By learning to highlight key trends and anomalies effectively, you become the translator who turns abstract data into business value, directly influencing organizational strategy.
You gain a competitive edge in the job market by combining rigorous statistical knowledge with visual communication skills. Employers increasingly seek professionals who can both analyze data accurately and present findings persuasively, making this dual expertise highly sought after in roles ranging from data science to business intelligence.
Engaging with a cohort of like-minded professionals fosters a supportive network for collaboration and career growth. Sharing challenges and solutions with peers accelerates your learning curve and opens doors to mentorship opportunities, ensuring you stay current with industry best practices.
Investing in this certificate is investing in your future, positioning you as a versatile leader capable of driving meaningful change through data.
3-4 Weeks
Study at your own pace
Course Brochure
Download our comprehensive course brochure with all details
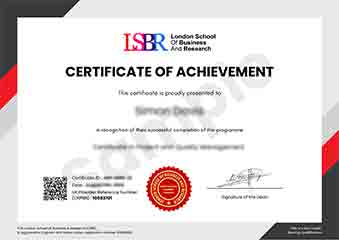
Sample Certificate
Preview the certificate you'll receive upon successful completion of this program.
Get Free Course Info
Receive detailed course information, curriculum breakdown, and career outcomes straight to your inbox.
Employer Sponsored?
Many employers cover professional development costs. Request a corporate invoice and we'll handle the rest. Bulk enrollment discounts available for teams of 3+.
How You Earn Your Certificate
Four simple steps to your professionally recognised qualification
Enroll & Get Instant Access
Complete your enrollment and access course materials immediately
Study at Your Own Pace
Work through the modules on your schedule, from anywhere in the world
Complete Assessments
Demonstrate your knowledge through practical, real-world assessments
Receive Your Certificate
Get your official LSBR UK certificate, recognised across 180+ countries
Real Results from Real Learners
Our graduates consistently report measurable career growth and professional advancement after completing their programmes.
Reviews from Our Learners
Hear from our students about their experience with the Postgraduate Certificate in Data Visualization Techniques for Statisticians at LSBR UK - Executive Education.
James Thompson
United Kingdom"The curriculum strikes an excellent balance between statistical theory and modern visualization tools, allowing me to transform complex datasets into clear, actionable insights. I now feel confident in creating interactive dashboards that effectively communicate nuanced statistical findings to non-technical stakeholders."
Anna Schmidt
Germany"Mastering advanced visualization techniques transformed my ability to translate complex statistical models into clear, actionable insights for stakeholders. This practical expertise directly accelerated my transition into a senior analytics role by bridging the gap between raw data and strategic decision-making."
Rahul Singh
India"The logical progression of modules seamlessly bridged my statistical background with advanced visual storytelling techniques, ensuring a smooth learning curve. This comprehensive curriculum significantly enhanced my ability to translate complex datasets into compelling narratives, directly boosting my confidence in professional presentations."
Need more time to decide?
Join 23,000+ professionals who advanced their careers. Enroll today and start learning immediately.
Enroll NowSecure payment • Instant access • Certificate included