
Undergraduate Certificate in Scientific Computing and Data Visualization
Master data visualization and scientific computing to drive data-informed decisions and enhance technical proficiency in your career.
Undergraduate Certificate in Scientific Computing and Data Visualization
About This Course
This Undergraduate Certificate in Scientific Computing and Data Visualization equips aspiring data professionals with the technical foundation to transform complex scientific datasets into actionable insights. Designed for students from diverse academic backgrounds, including biology, physics, and engineering, the curriculum bridges the gap between theoretical science and practical computational application. You will engage with industry-standard tools to manage large-scale data structures while learning to interpret results within rigorous scientific contexts. The programme welcomes individuals seeking to pivot into data-driven roles or deepen their existing technical expertise through structured, hands-on learning experiences.
Learners will master Python and R programming languages to perform advanced statistical analysis and algorithmic problem-solving. You will develop proficiency in data cleaning techniques, ensuring accuracy before applying machine learning models to predict trends and patterns. The course emphasizes visual communication, teaching you to create clear, impactful charts and interactive dashboards using libraries like Matplotlib and Tableau. Participants also gain critical knowledge in database management and version control, fostering reproducible research practices essential for modern scientific workflows.
Graduates emerge ready to secure roles such as Data Analyst, Scientific Programmer, or Visualization Specialist in research institutions and tech firms. This certification significantly enhances your employability by demonstrating verified competence in handling real-world data challenges. Employers value the ability to translate raw numbers into strategic decisions, a core competency this programme instills. You will build a professional portfolio showcasing your analytical projects, positioning yourself for immediate contribution in competitive job markets.
What You Will Learn
Transform raw data into compelling visual stories with our Undergraduate Certificate in Scientific Computing and Data Visualization. This dynamic programme bridges the gap between complex computational methods and intuitive design, empowering you to communicate scientific insights with clarity and impact. You will gain a competitive edge by mastering the tools and techniques that modern industries desperately need to interpret vast datasets.
Your journey begins with foundational programming in Python and R, essential languages for handling large-scale scientific data. You will delve into statistical analysis, learning to identify patterns and validate hypotheses with precision. The curriculum then shifts toward visualization, where you explore principles of graphic perception and interactive dashboard creation using libraries like Matplotlib and Tableau. You will also tackle real-world challenges through capstone projects that simulate professional environments, ensuring you leave with a portfolio that demonstrates your ability to turn abstract numbers into actionable intelligence.
Graduates apply these skills across diverse sectors, from healthcare analytics to environmental modeling. You will find yourself transforming clinical trial results into clear reports for stakeholders or visualizing climate trends for policy makers. The ability to translate technical findings into accessible visuals is a rare and highly valued asset.
Career opportunities abound for those who complete this certificate. You might pursue roles as a Data Analyst, Scientific Visualizer, or Junior Data Scientist. Organizations in finance, technology, and research institutions actively seek professionals who can both compute and communicate. By joining this programme, you position yourself at the intersection of science and storytelling. You will not only learn to analyze data but also to present it in ways that
Course Benefits
Industry-Aligned Curriculum
Developed with industry leaders for job-ready skills
Globally Recognised Certificate
Recognised by employers across 180+ countries
Flexible Online Learning
Study at your own pace with lifetime access
Instant Access
Start learning immediately, no application process
Constantly Updated Content
Latest industry trends and best practices
Career Advancement
87% report measurable career progression within 6 months
What This Course Covers
- Programming for Data Science: Introduces Python and applies Python programming fundamentals for data manipulation and analysis.: Statistical Computing: Covers statistical methods and their implementation using computational tools for inference.
- Database Management and SQL: Teaches structured query language for efficient data storage, retrieval, and management.: Data Visualization Principles: Explores visual encoding, design aesthetics, and best practices for effective communication.
- Advanced Visualization Tools: Provides hands-on training with libraries like Matplotlib, Seaborn, and Plotly for creating interactive graphics.: Capstone Data Project: Integrates all learned skills to solve a real-world problem through data cleaning, analysis, and visualization.
Everything You Get With This Course
Course Facts
Audience: Aspiring data analysts and tech professionals seeking quick upskilling.
Prerequisites: Basic programming knowledge and strong interest in data science.
Outcomes: Master visualization tools and gain immediate, practical computing skills.
Ready to Advance Your Career?
Join thousands of professionals who have transformed their careers with LSBR UK
Why This Course Is Right for You
Embarking on aking on the Undergraduate Certificate in Scientific Computing and Data Visualization offers a powerful pathway to elevate your professional profile. This program equips you with essential technical skills that are increasingly demanded across diverse industries. Here is why this certificate is a strategic investment in your future.
Master Industry-Standard Tools: You will gain hands-on experience with Python, R, and advanced visualization libraries like Matplotlib and D3.js. These tools allow you to transform raw data into compelling visual narratives, making complex information accessible to stakeholders and driving better decision-making within organizations.
Enhance Analytical Rigor: The curriculum emphasizes statistical computing and algorithmic thinking. By learning to clean, process, and analyze large datasets efficiently, you develop the critical thinking skills necessary to solve real-world problems. This analytical depth distinguishes you as a candidate who can derive actionable insights rather than just reporting numbers.
Boost Career Versatility: Data literacy is no longer confined to tech roles. Professionals in healthcare, finance, and marketing benefit immensely from these skills. Earning this certificate signals to employers that you possess the hybrid expertise to bridge the gap between technical data analysis and strategic business goals, opening doors to roles such as data analyst or business intelligence specialist.
Accelerate Professional Growth: This focused program provides a quick yet comprehensive upskilling opportunity. You can apply these new competencies immediately in your current role, demonstrating value and increasing your potential for promotion
3-4 Weeks
Study at your own pace
Course Brochure
Download our comprehensive course brochure with all details
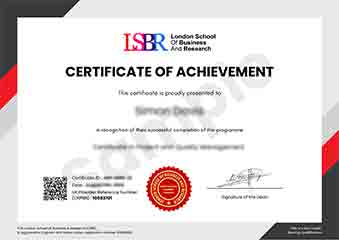
Sample Certificate
Preview the certificate you'll receive upon successful completion of this program.
Get Free Course Info
Receive detailed course information, curriculum breakdown, and career outcomes straight to your inbox.
Employer Sponsored?
Many employers cover professional development costs. Request a corporate invoice and we'll handle the rest. Bulk enrollment discounts available for teams of 3+.
How You Earn Your Certificate
Four simple steps to your professionally recognised qualification
Enroll & Get Instant Access
Complete your enrollment and access course materials immediately
Study at Your Own Pace
Work through the modules on your schedule, from anywhere in the world
Complete Assessments
Demonstrate your knowledge through practical, real-world assessments
Receive Your Certificate
Get your official LSBR UK certificate, recognised across 180+ countries
Real Results from Real Learners
Our graduates consistently report measurable career growth and professional advancement after completing their programmes.
Reviews from Our Learners
Hear from our students about their experience with the Undergraduate Certificate in Scientific Computing and Data Visualization at LSBR UK - Executive Education.
James Thompson
United Kingdom"The curriculum strikes an excellent balance between theoretical foundations and hands-on application, particularly in mastering Python libraries for data manipulation. I now feel confident in transforming raw datasets into compelling visual narratives, a skill that has immediately enhanced my professional portfolio."
Charlotte Williams
United Kingdom"Mastering Python and data visualization tools through this certificate gave me the technical confidence to lead complex analytics projects at my new role. The curriculum’s focus on real-world data interpretation directly bridged the gap between academic theory and the practical demands of the tech industry."
Liam O'Connor
Australia"The logical progression of modules seamlessly bridges theoretical foundations with practical data visualization techniques, creating a cohesive learning experience. This structured approach has significantly enhanced my ability to translate complex datasets into actionable insights for professional contexts."
Need more time to decide?
Join 23,000+ professionals who advanced their careers. Enroll today and start learning immediately.
Enroll NowSecure payment • Instant access • Certificate included